Română
Visual References - Technique Taxonomy
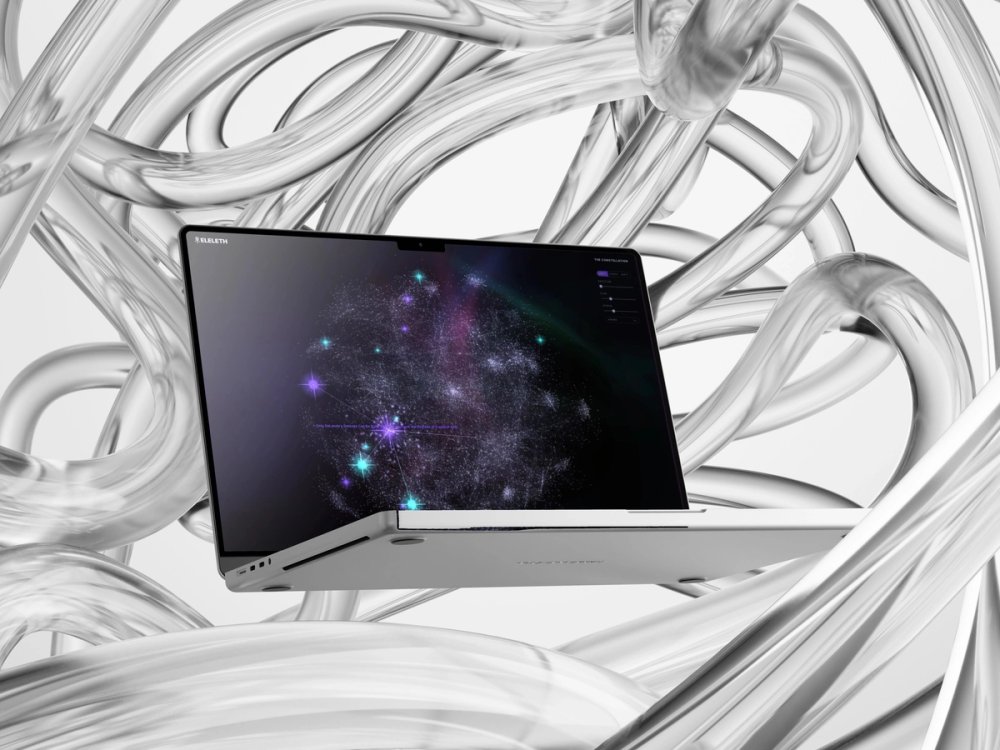
Visual References is the app where I keep every image I save for design work. The taxonomy on top of it sorts them by the mechanism that makes them work: what an image asks your eye to do, what it works through, and the technique that does it. I built the app and the taxonomy, mapped the library with Claude and published the framework on GitHub.
VIEW THE TAXONOMY ON GITHUB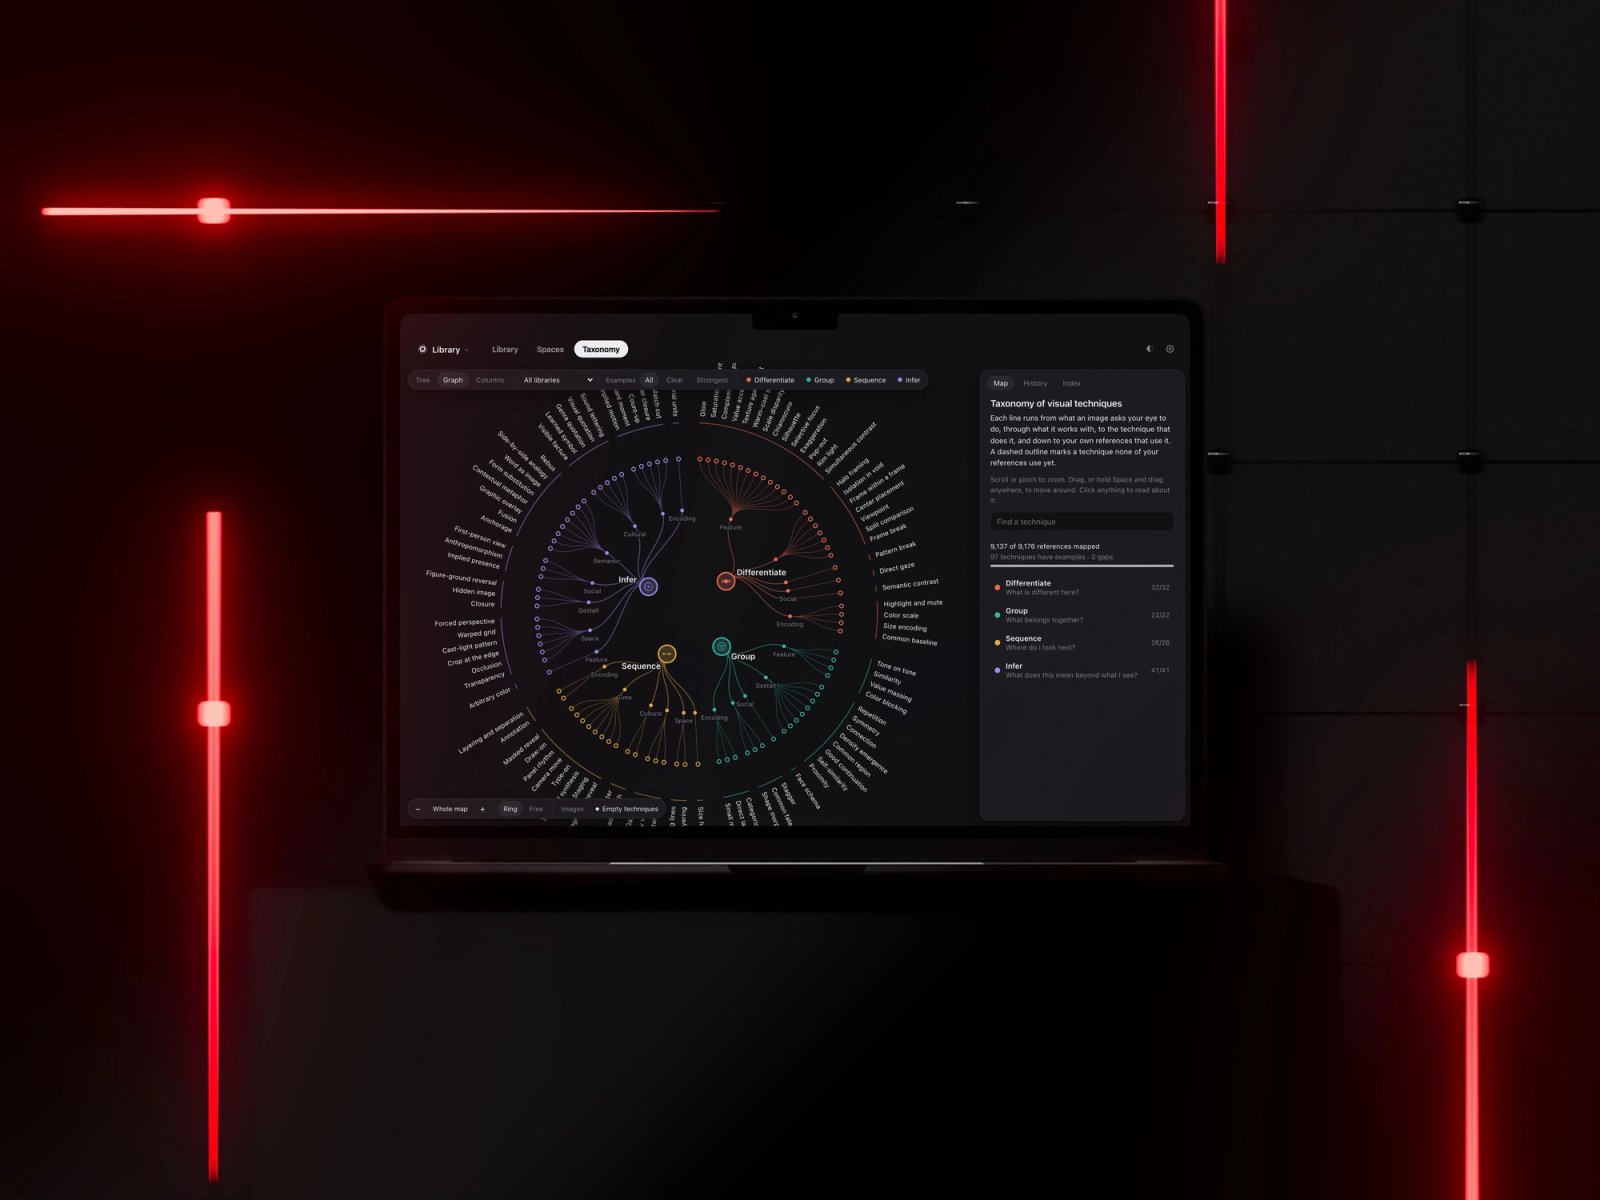
Thousands of references, and no way to ask why they work
My reference library holds years of saved images, moved out of a subscription app into one I built myself and described in words. Search could find a dark poster or a red layout. It had no answer to the question I ask on every project: why does this image work, and where else have I seen that done?
A map of how images work
The taxonomy starts from four questions an image puts to your eye: what is different here, what belongs together, where do I look next, and what does this mean beyond what I see. Each question opens into domains such as space, time or culture, and each domain into techniques like chiaroscuro or closure, 97 in all. Every reference links to the techniques it uses, so the library now answers by mechanism.
Research & Definition
- 01Moved the library out of a subscription app and into my own, checked one to one against the original.
- 02Described the references with Claude, so the images could be searched in words.
- 03Built the taxonomy in four levels: operation, domain, technique, execution.
- 04Tested it on 60 references with two independent Claude raters. They chose the same lead technique 75% of the time, and the disagreements became new rules.
- 05Mapped the whole library with Claude agents working from the same definitions.
- 06Published the framework on GitHub under CC BY 4.0.

The Mac's system font across the whole interface, quiet next to thousands of images.
Settings and technical metadata.
Every line ends in a technique
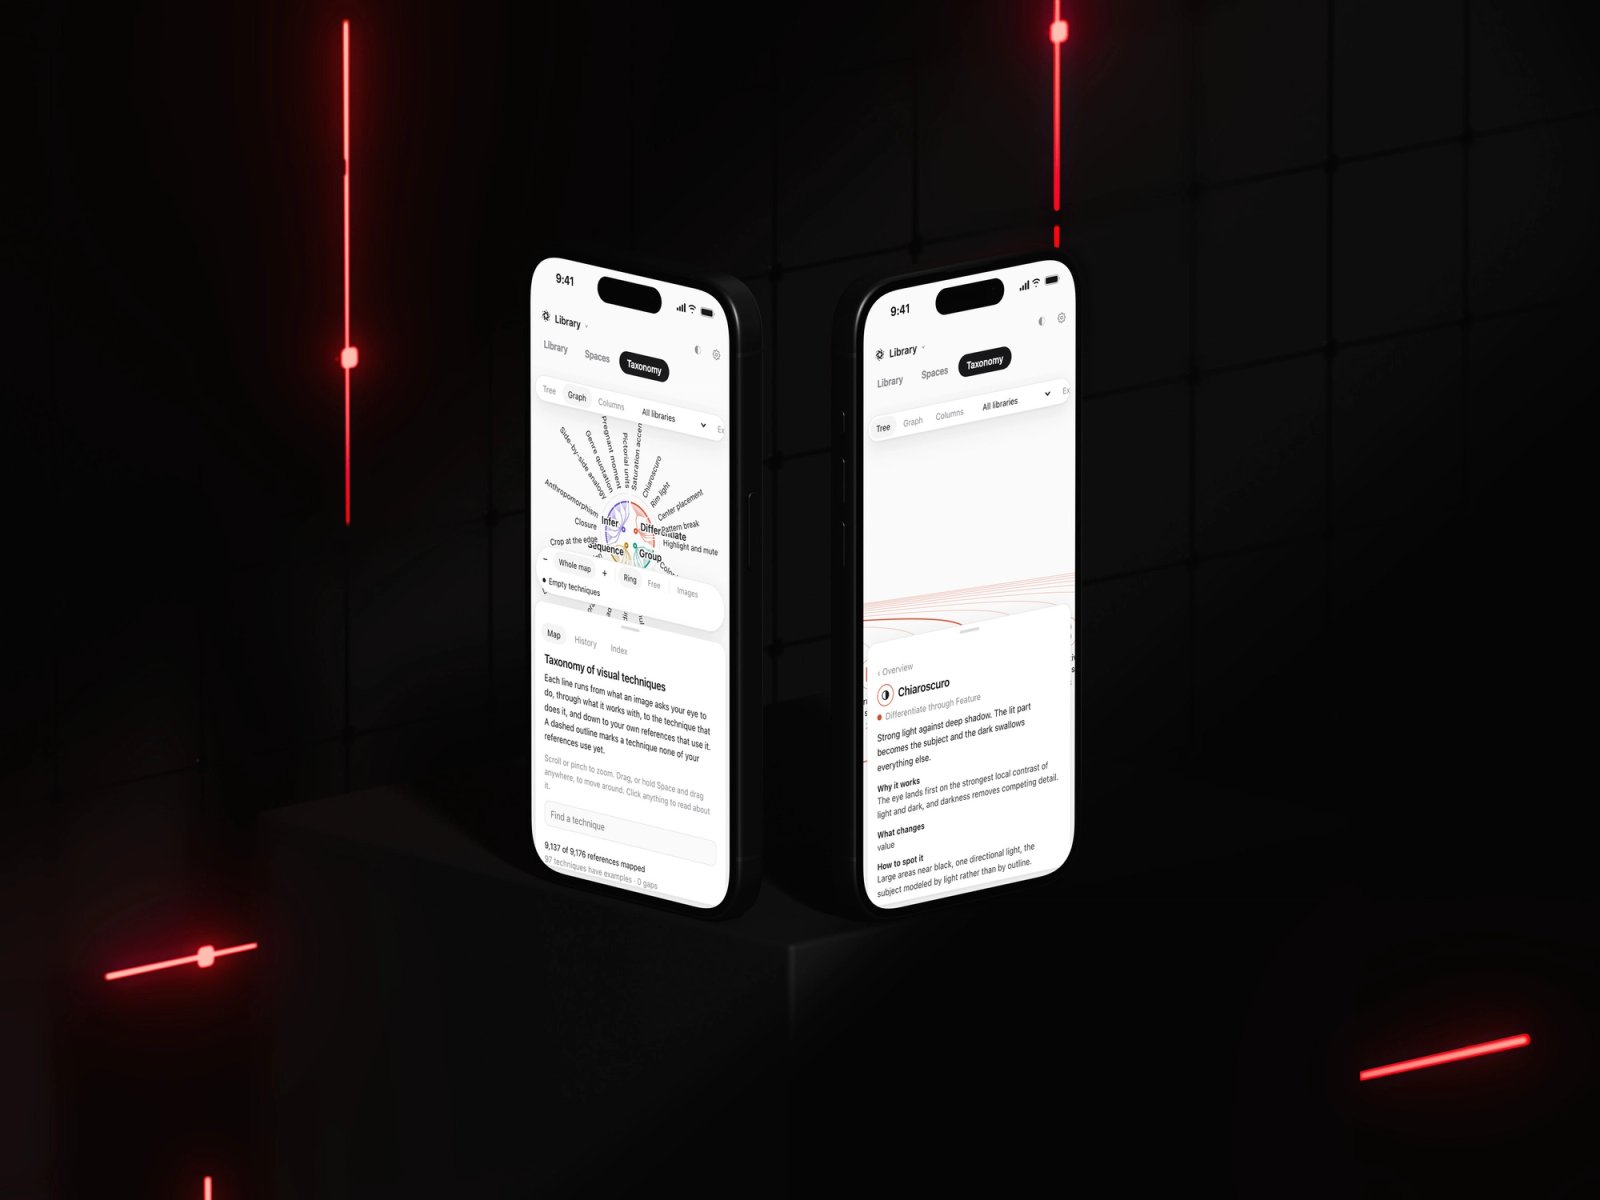
The ring reads from the center out: a question, the domain it works through, then the technique. Click an operation to fly into its branch, pull back to the whole map, or type a name and land on a technique's card. Images can sit on the map too. I keep them off here because the references are other people's work.
One branch at a time
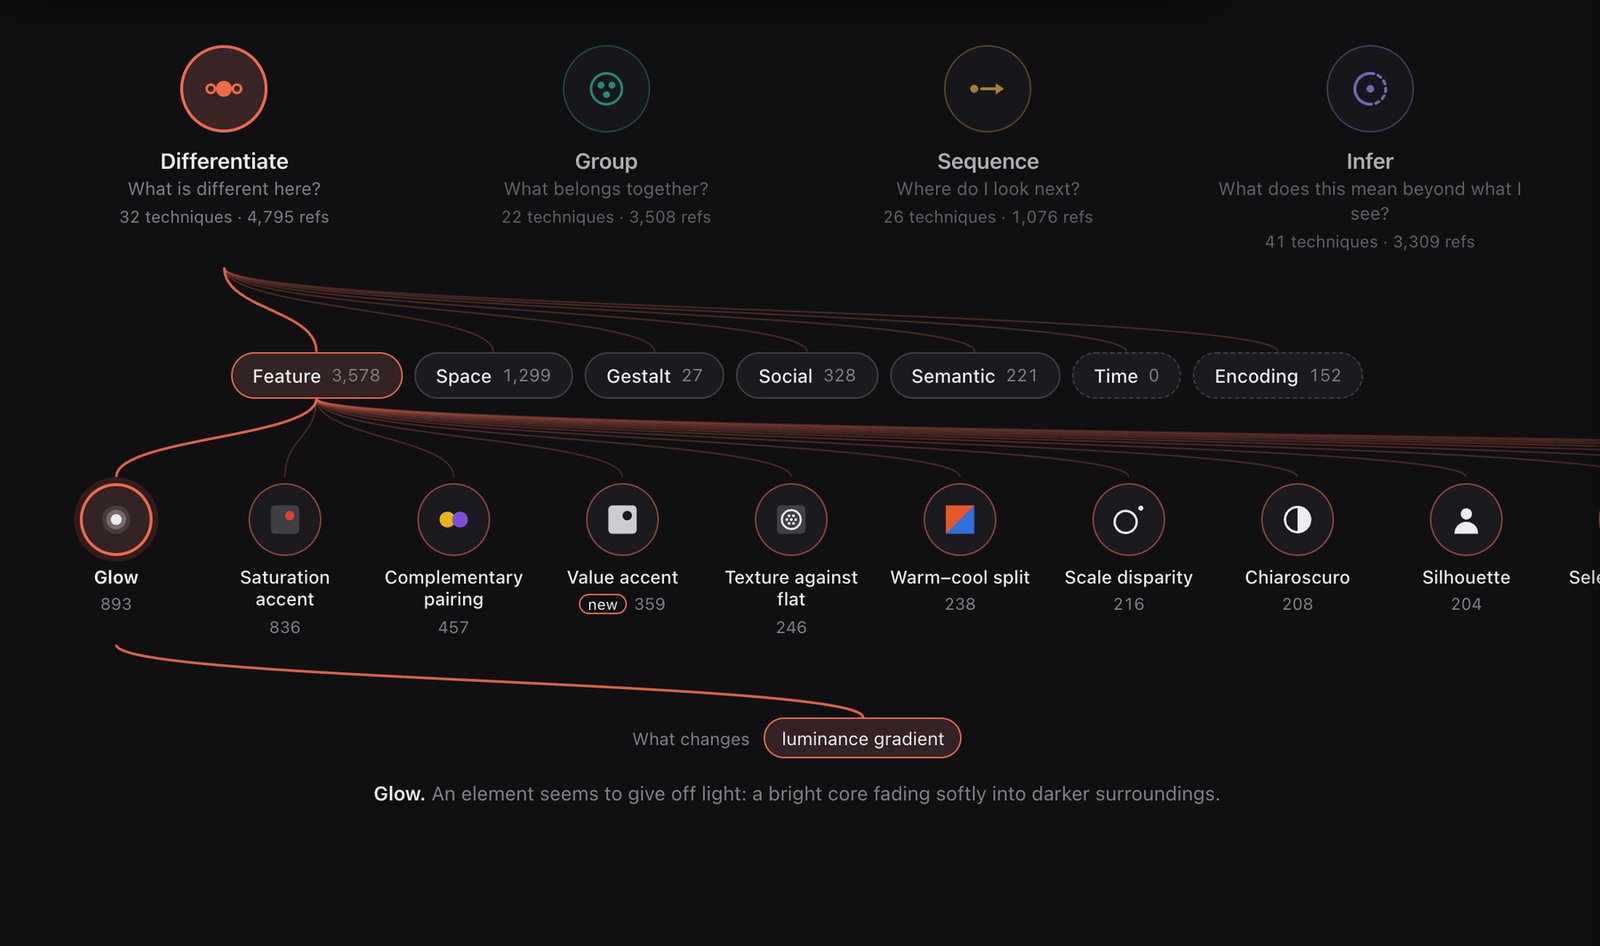
The tree opens one path: pick a question, then a domain, and its techniques line up by how often they appear in the library, each with its own icon and count. Pick one and it shows what changes in the image, a good place to start when a layout feels flat.
A card for every technique
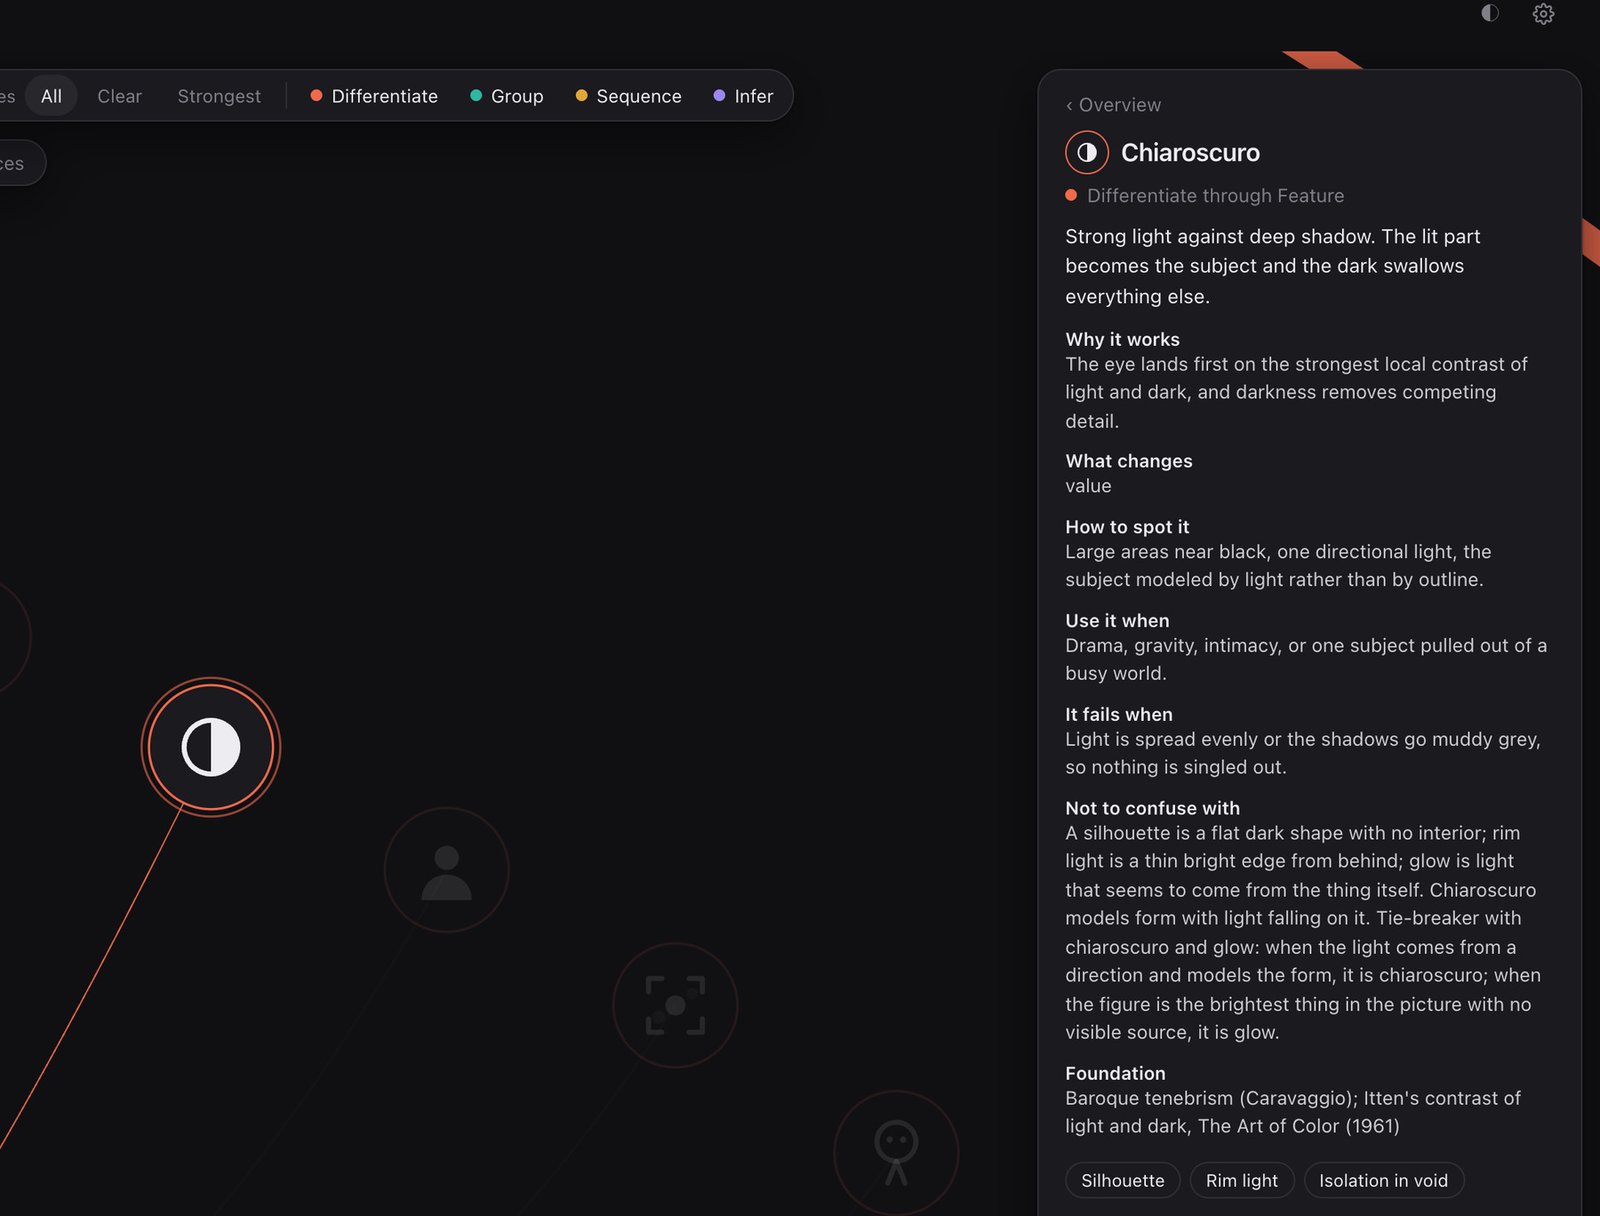
Each card says what the technique is, why it works, what changes, how to spot it, when to use it and when it fails. It also sets the technique apart from its closest neighbors and names where the idea comes from, like Caravaggio and Itten for chiaroscuro.
Claude works from the same map
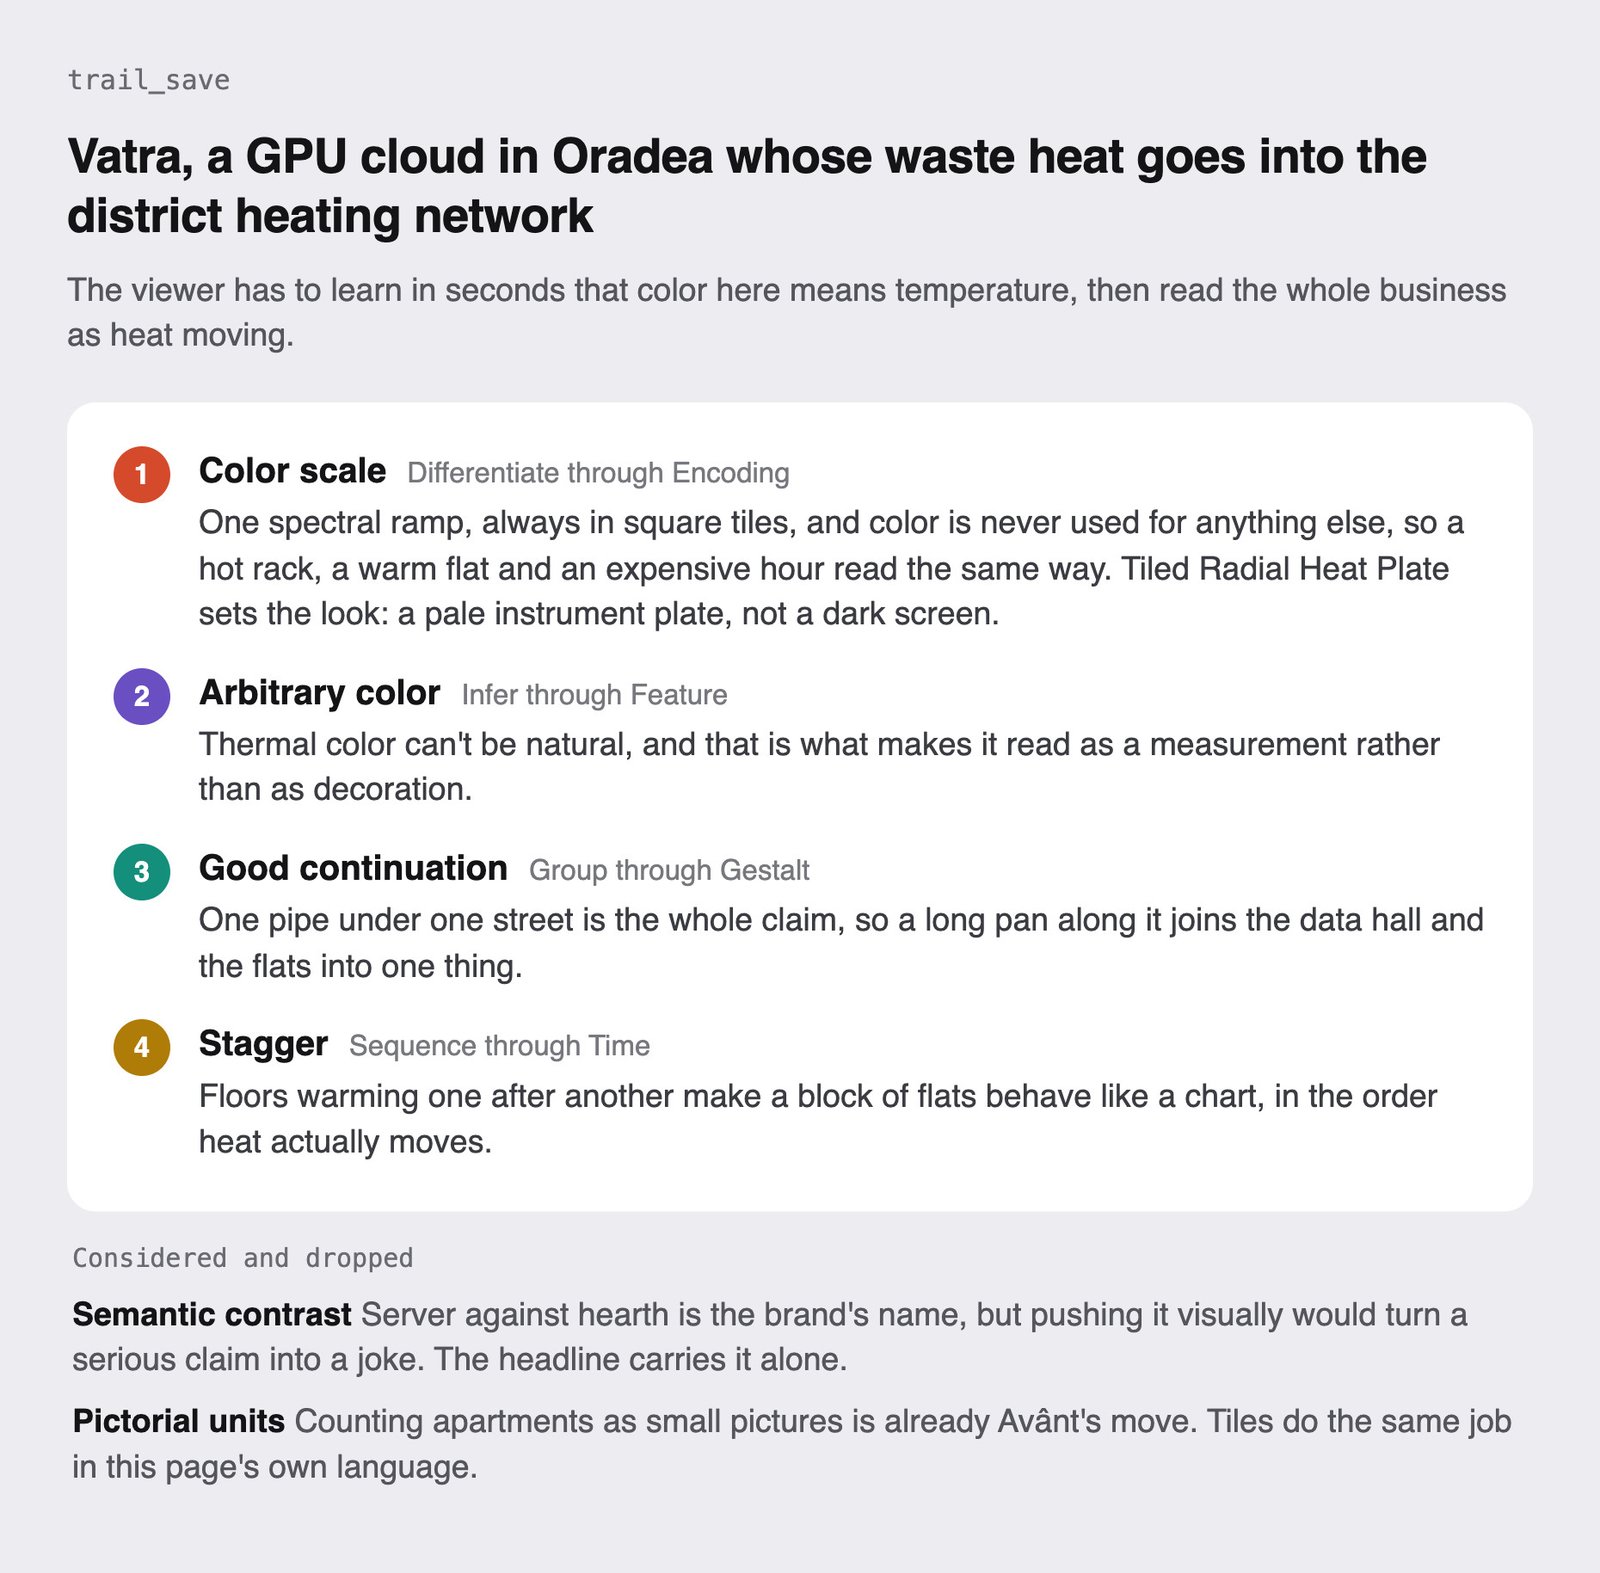
A connector gives Claude the taxonomy and my library. Give it a brief and it picks techniques, finds references that use them and saves its reasoning as a trail, including what it dropped. The trail here led to Vatra, one of my demo landings. The framework is public too: a README, a Claude skill and a spreadsheet template for anyone's own library.

Iteration & Refinement
The first map was 5,300 pixels wide
One long row of techniques was unreadable on a laptop. I moved to four columns, then a force graph, then the ring and the tree, which fit a single screen and still show every technique.
Seven more for motion
A library of animated references needed words still images never did, so version 1.7 added seven techniques for time, such as type-on, masked reveal and stagger. The app runs that version, and GitHub holds the 90 techniques before it.